Hello, today I begin a new stage of my life, first is building and learning to make a blog in WordPress, and where I want to contribute to the Business Central community through my experiences, achievements, and challenges. I have many things I want to share.
In this post, we are going to see how the Performance Profiler works with 2 created examples.
The Performance Profiler is a performance analyzer that allows you to monitor the processes running on any Business Central page. The idea is to identify, if there is an extension, that is causing the slowdown in some page/process in order to be able to notify the company/developer responsible for it and thus be able to correct the problem. It should be noted that this is a novelty of BC V20.
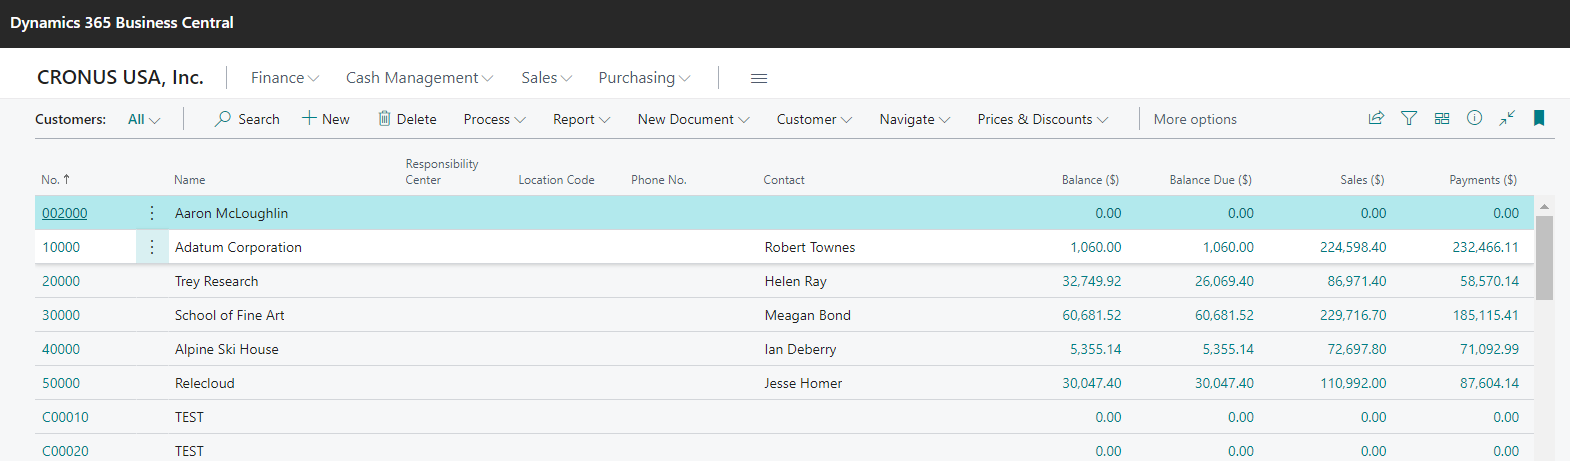
To analyze the performance of the Performance Profiler, we are going to run the Customers List page, without any extension as a first step.
For this, we go to Help & Support .


The Performance Profiler module will open, where we will click on the Start button.

The message “The performance profiler is now running” will appear.

Once running, for this example, we will open the Customer window (where we have installed an extension that slows down the loading of the page)

Our Customer window will open with a delay of more than 50 seconds
Now we go to the Performance Profiler, and click on Stop.

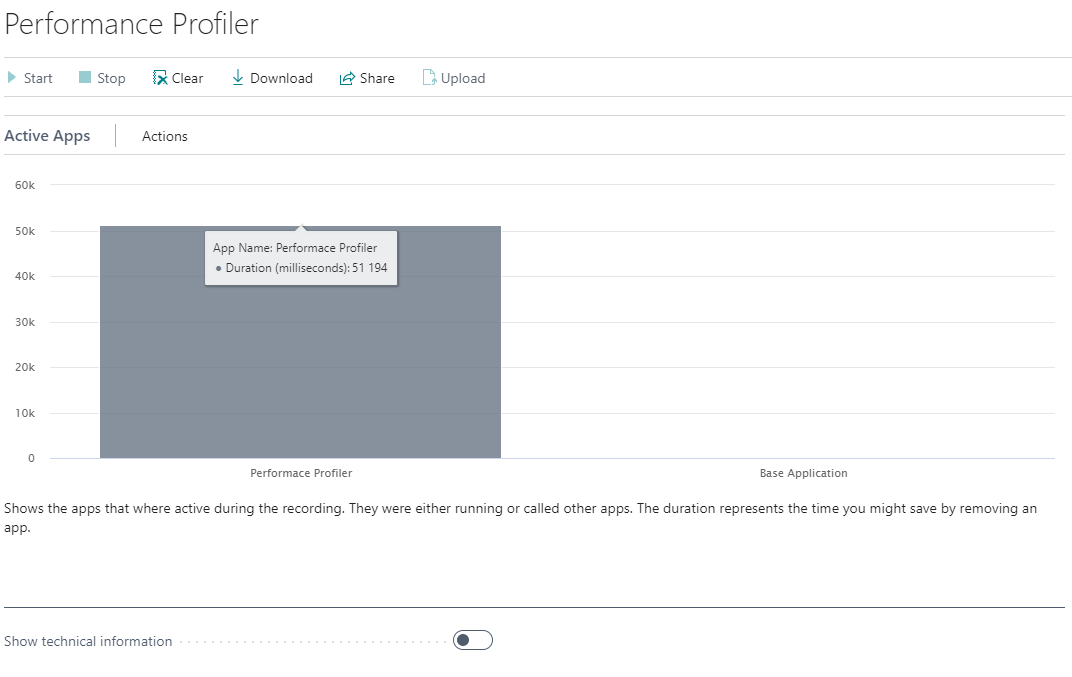
Analyzing the Performance Profile.
As we can see, the first thing that will appear is that there was a duration of 51194 miliseconds, and the extension responsible for this delay is called “Performance Profiler”

If we click on Show technical Information and scroll down a bit we can see the “Time Spent” fastab that has the App Name and App Publisher actions. This is useful in case there is more than one extension installed in the BC, we can classify which of the extensions is the one that is causing the delay with more problems.

Then we have, the most important thing, the Call Tree, which will indicate, within the extension, the total time classified by events processes of the extension that was taken at the opening of the page.
Call Tree

Time Spent by Applicaction Object
As we can see in the following image, the “OnAfterGetRecord” method was responsible for the delay of more than 51 seconds.

Which is absolutely correct, because in our extension, we have a 1000milisecond Sleep on that event.

To dig a little deeper, I’ve modified the plugin to add an OnOpenPage trigger delay of 2000miliseconds and lowered the OnAfterGetRecord trigger time to 10miliseconds.

If we do the whole process again, we can see that the Performace Profiler identifies on this occasion the 2 events that slow down the Customer List page.


Something interesting that can be seen is that, for example, in the OnOpenPage trigger, the sleep of 2000 milisencod is not exact, but of 1962.
Downloading the report
Lastly, as administrators we could download the report to share it with the company/developer so that they can carefully analyze the behavior of the extension.
To do this, we click on Download.

A window will appear to us if we are sure to continue since there could be sentitive data.

This will save us a file with the extension “.alcpuprofile”

That if we open it in the visual studio, we can see the same information but more detailed. Even if we open it with the extension that was published for the example, clicking on any of the events will take us to the code that generated the problem.

This tool is very powerful for diagnosing performance issues and identifying which extension has been causing the slowdown problem.