How a fuzzy logic classifier born in a Venezuelan university became a satellite image classification platform with 6 ML models, ensemble methods, and 484 unit tests.
In November 2008, I defended a thesis at Universidad de Los Andes in Merida, Venezuela. The title was “Desarrollo de un Clasificador de Imagenes Satelitales Basado en Logica Difusa” (Development of a Satellite Image Classifier Based on Fuzzy Logic). The idea was straightforward: take multispectral satellite images, where every pixel carries reflectance values across multiple bands of light, and classify land cover automatically. Not with rigid thresholds, but with degrees of membership. Fuzzy logic.
The result was 81.87% Overall Accuracy with a Kappa coefficient of 0.7637, outperforming three classical methods of that era. But everything ran on MATLAB and IDRISI, software that costs thousands of dollars per license. The thesis was defended, the diploma handed out, and 105 pages of algorithms were archived. Nobody could replicate the work without buying the same expensive software.
18 years later, the world had changed: free satellite imagery from Sentinel-2 Copernicus, open-source libraries like GDAL and ML.NET, and GitHub to share code with the world. That thesis was the spark. What exists today is something much larger.
What Terra ML Is Today
Terra ML is an open-source satellite image classification platform built in C# 13 and .NET 10. It is not a port of a thesis. It is a new project, professionally engineered, inspired by that thesis but going far beyond it.
The platform offers three classification modes: pure fuzzy logic (the original method, fully explainable), hybrid mode (fuzzy logic as an intelligent preprocessor for machine learning), and pure ML (raw spectral values fed directly into classifiers, for baseline comparison). On top of that, it includes 6 production ML classifiers, 2 ensemble methods, k-fold cross-validation, a complete Blazor web application, a CLI, and Docker support.
How Fuzzy Classification Works
A satellite image is not a photograph. It is a stack of layers, each capturing a different wavelength of light: visible, near-infrared, shortwave infrared. Every pixel has a numerical value per layer. Each material on the ground has its own spectral fingerprint: water absorbs most light and appears dark across all bands; forests explode with reflectance in near-infrared; urban areas have a distinctive signature in shortwave infrared.
Classical approaches draw rigid lines: “if infrared is above 100, it’s forest.” Fuzzy logic works differently. It says: “this pixel looks 97% like urban, 2% like forest, and 0.3% like water.” Degrees of membership. This is more realistic because in nature, transitions between land cover types are gradual, not sharp lines on a map.
The classification process follows four steps.
Training begins when an expert identifies pixels with known land cover (water, forest,
urban). Terra ML computes the mean and standard deviation of each class across each spectral band.
These statistics become Gaussian membership functions: bell curves defined by
μ(x) = exp(−½((x − mean) / σ)²).
When a new pixel arrives, fuzzification evaluates it against every curve, producing a membership degree between 0 and 1 for each class in each band. Then, inference applies the fuzzy AND operator (minimum) across all bands per class. The logic is intuitive: you are only as “Urban” as your weakest band says you are. The weakest link breaks the chain.
Finally, defuzzification assigns the class with the highest firing strength. If Urban scores 0.97 and Forest scores 0.02, the pixel is classified as Urban. And crucially: if someone asks “why was this pixel classified as forest?” you can show exactly which curve on which band gave which membership degree. Total explainability.
Three Ways to Classify: The Evolution
Terra ML does not stop at fuzzy logic. It offers three paths, and the reason for each reflects an honest evolution of the project.
Path 1: Pure Fuzzy Logic
The original method from the thesis. Works with very little training data, is completely explainable, and produces reasonable results. But it has a fundamental limitation: its decision rule is fixed. Take the minimum membership across bands, pick the maximum. Elegant, but it cannot learn complex inter-class patterns. When two classes have very similar spectral signatures, the firing strengths may differ by only 0.02. At that margin, sensor noise can flip the classification.
Path 2: Hybrid Mode (Fuzzy + ML)
This is where fuzzy logic finds its best version: not as the final classifier, but as an intelligent preprocessor. A pixel with 4 spectral bands gives an ML model 4 numbers without context. But if that pixel first passes through the fuzzy engine, you get 39 numbers with semantic context: the 4 original raw values, 28 membership degrees (how much the pixel resembles each of the 7 classes in each of the 4 bands), and 7 firing strengths (the fuzzy inference result per class).
Path 3: Pure ML
Raw spectral values go directly into a machine learning classifier, bypassing fuzzy logic entirely. This serves as a baseline for comparison, or for datasets where fuzzy preprocessing does not add value. Terra ML does not force you into one approach. It gives you the tools to compare and decide based on your own data.
Six Classifiers, Two Ensemble Methods
Terra ML integrates six production-ready classifiers, each with its own strengths.
| Classifier | Engine | Best For |
|---|---|---|
| Random Forest | ML.NET | General-purpose, robust with noisy data |
| SDCA MaxEntropy | ML.NET | Large datasets, fast convergence |
| LightGBM | ML.NET | High accuracy, gradient boosting |
| SVM (One-vs-All) | ML.NET | High-dimensional feature spaces |
| Logistic Regression | ML.NET | Calibrated probabilities, interpretable |
| MLP Neural Network | TorchSharp | Complex non-linear patterns |
Beyond individual classifiers, Terra ML offers two ensemble methods. The VotingClassifier combines predictions from multiple models through majority or weighted voting. The StackingClassifier goes further: it trains base classifiers on k-fold subsets, then trains a meta-learner (Logistic Regression) on out-of-fold predictions, discovering which classifier is most reliable in which situations while preventing data leakage through stratified splitting.
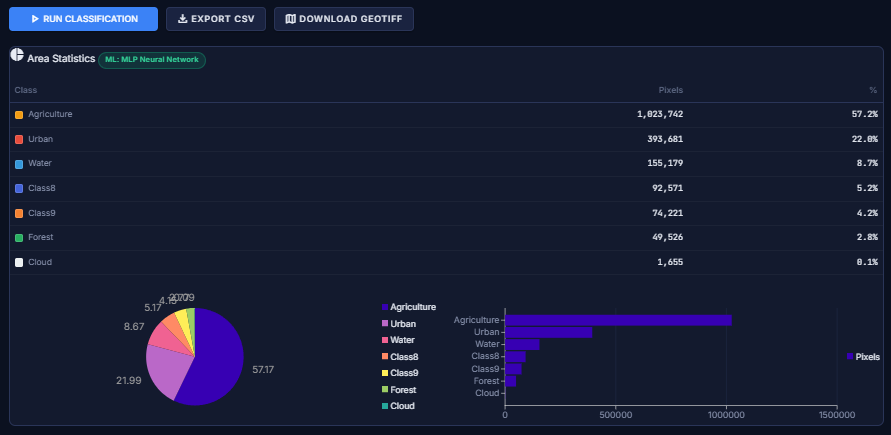
The ModelComparisonEngine ties everything together: it runs k-fold cross-validation for all classifiers in both hybrid and pure ML modes, producing a ranking by Overall Accuracy and Kappa coefficient. Concrete, data-driven evidence of what works best for your specific dataset.
Architecture
The codebase follows a clean layered architecture with strict separation of concerns.
FuzzySat.Core contains the entire classification engine: membership functions (Gaussian, Triangular, Trapezoidal, Generalized Bell), the inference engine with configurable AND operators (minimum or algebraic product), two defuzzifiers (MaxWeight and WeightedAverage), all six ML classifiers, feature extractors, ensemble methods, validation metrics (confusion matrix, Kappa, per-class accuracy), and GDAL-based raster I/O with spectral index calculators (NDVI, NDWI, NDBI). Pure logic, no UI dependencies.
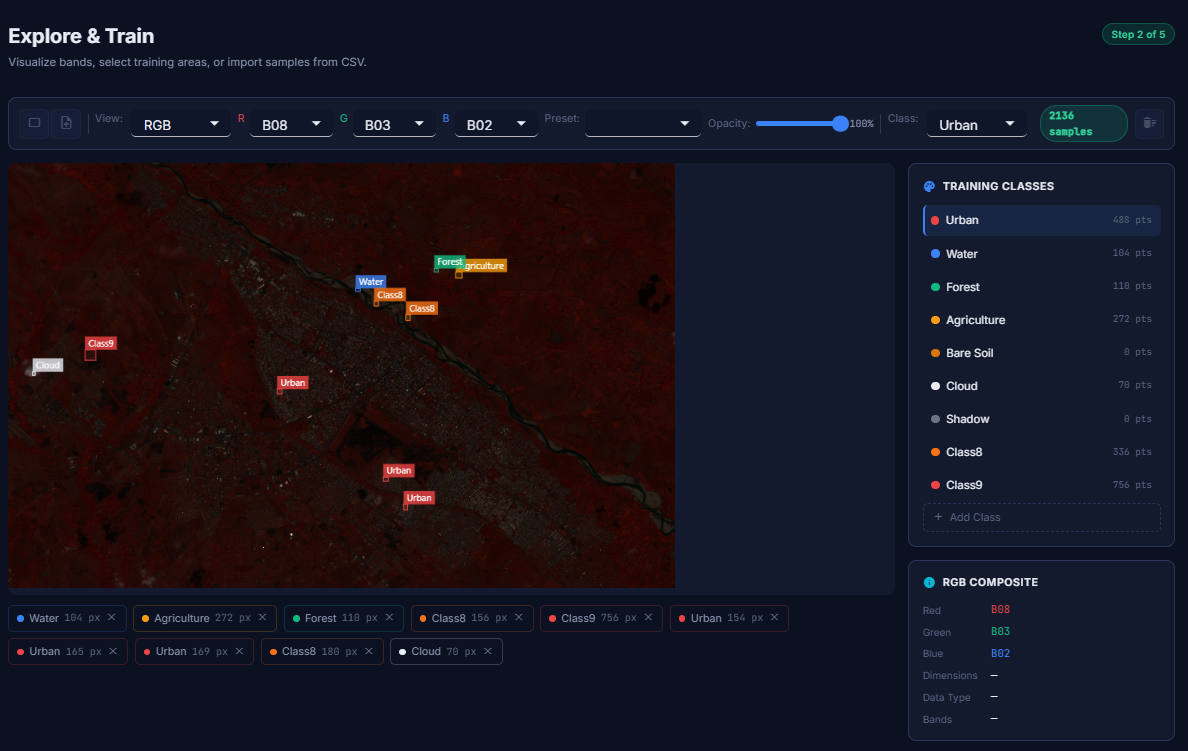
On top of that sit two interfaces: a Blazor Server web application with 7 pages
that guide users from project setup through model comparison (built with Radzen components),
and a CLI with 5 commands (classify, train,
validate, info, visualize) for scripting and automation.
Deployment is flexible: run directly with dotnet run, or spin up Docker with
docker compose up and access the web UI at localhost:8080. No SDK
or GDAL installation required.
The 2008 Benchmark
The original thesis compared the fuzzy logic classifier against three traditional methods available in IDRISI, all evaluated on the same ASTER imagery of Merida, Venezuela, with 7 land cover classes and a ground-truth sample of 171 validation points.
| Classifier | Overall Accuracy | Kappa |
|---|---|---|
| Fuzzy Logic (thesis) | 81.87% | 0.7637 |
| Maximum Likelihood | 74.27% | 0.6650 |
| Decision Tree (CART) | 63.74% | 0.5312 |
| Minimum Distance | 56.14% | 0.4233 |
A Kappa of 0.76 is considered “substantial agreement” in the remote sensing literature. The fuzzy classifier outperformed all three classical methods by significant margins, validating the core thesis that degrees of membership better reflect the gradual transitions between land cover types found in nature.
2008 vs. 2026
| Aspect | Original Thesis (2008) | Terra ML (2026) |
|---|---|---|
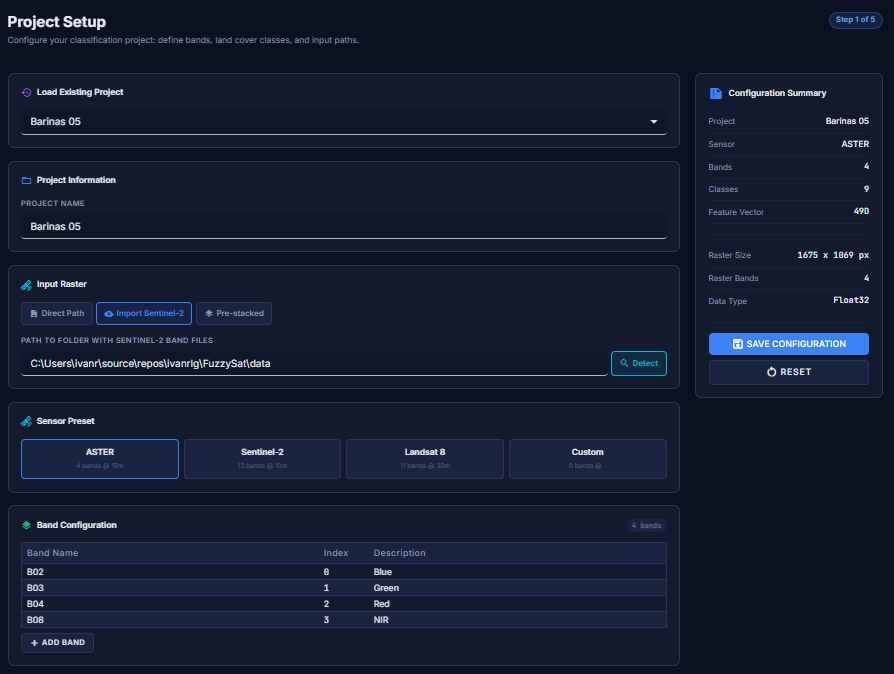
| Platform | MATLAB + IDRISI (proprietary) | C# / .NET 10 + GDAL (open source) |
| Imagery | ASTER (4 bands, 15m) | Any GeoTIFF incl. Sentinel-2 (13 bands, 10m) |
| MF Types | Gaussian only | Gaussian, Triangular, Trapezoidal, Gen. Bell |
| ML Integration | None | 6 classifiers + 2 ensemble methods |
| Modes | Fuzzy only | Fuzzy, Hybrid, Pure ML |
| Interface | MATLAB GUI | Blazor Web + CLI + Docker |
| Validation | Single confusion matrix | k-fold cross-validation + model comparison |
| Tests | None | 484 (math correctness verified) |
| License | Academic only | MIT (open source) |
484 Tests That Verify Math, Not Just Compilation
The test suite (349 Core + 119 Web + 16 CLI) goes beyond “does it compile.” One test confirms
the Gaussian function at exactly one sigma distance produces exp(−0.5) ≈ 0.6065.
Another builds a 7-class confusion matrix with 171 samples and verifies 81.87% accuracy,
matching the original thesis result. Another trains a Random Forest on synthetic data and
confirms correct classification. Others create real GeoTIFF files with GDAL, write them,
read them back, and verify pixel values.
These are not ceremonial tests. They are the mathematical contract between the thesis and the code.
Where It Stands (Honestly)
I want to be upfront about something: Terra ML is a growing project, not a finished product. The classification engine works, the 484 tests pass, the architecture is solid. But the full validation pipeline against real-world Sentinel-2 imagery has not been executed yet. The 81.87% accuracy figure comes from the original 2008 thesis, on a specific ASTER dataset. Whether those numbers hold, improve, or change with modern imagery and the hybrid approach is something I have not yet measured.
I am building this in my spare time, and spare time is not something I have a lot of. Some weekends I push a dozen commits; other weeks, nothing. That is the reality of a solo open-source project built with passion but constrained by life.
Pure fuzzy logic classification worked well in 2008. An 81.87% accuracy is no small achievement, especially beating all three alternative methods. But image classification has advanced enormously since then. What has been observed during development is that machine learning approaches, especially when fed with features enriched by fuzzy logic, tend to produce better results. There are more tests to run and more conclusions to draw, but the trend is promising.
Each mode has its place. Pure fuzzy logic offers total explainability and requires very little training data, making it excellent for education and for understanding the fundamentals of spectral classification. Hybrid mode combines physical understanding with learning capability. Pure ML serves as a baseline. And ensemble methods combine multiple perspectives for robustness.
Terra ML does not compete with ArcGIS, IDRISI, or Google Earth Engine. Those are tools with decades of development and enormous teams. But Terra ML is a serious, open-source, free platform that puts satellite classification tools within reach of students, researchers, and the geospatial community. It is not perfect. It is alive, growing, and getting better with each commit.
What Comes Next (and an Invitation)
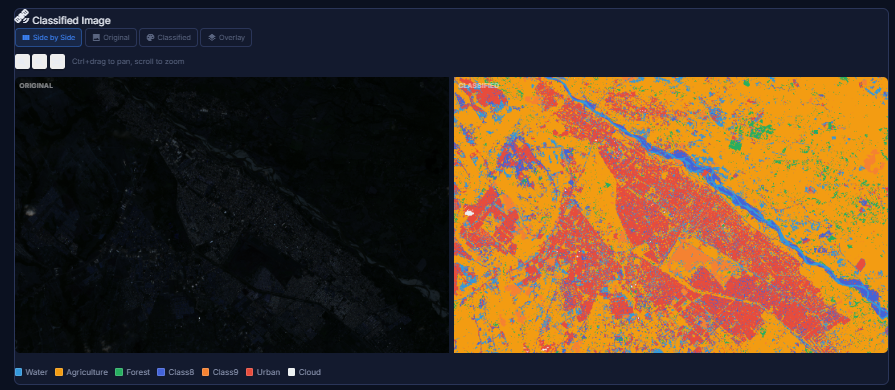
The next step is real-world validation with Sentinel-2 imagery from Copernicus: define training areas, classify, measure accuracy, compare all methods side by side, and publish the results. Whatever they may be.
The vision is for Terra ML to serve as a bridge. For remote sensing students who want to understand classification from the mathematical foundations, with code they can read and modify. For researchers who need explainable models where every decision can be traced back to specific membership degrees. For the open-source community working with satellite imagery that wants a free alternative to proprietary solutions. And for anyone who wants to experiment with satellite classification without barriers: no licenses, no costs, free imagery, and Docker to spin everything up in a single command.
And if any of that resonates with you: the door is open. Terra ML is not “my” project in the possessive sense. It is open source because I believe it should grow beyond what one person can build in their spare time. If you are a remote sensing researcher who wants to add a new classifier, a .NET developer who sees something that could be better, a student who wants to learn by contributing, or someone with a completely different perspective on how this should evolve, you are welcome. The CONTRIBUTING.md explains how to get started. Issues labeled good-first-issue and help-wanted are there for a reason.
The code is on GitHub. The license is MIT. Contributions are welcome.
From a 2008 thesis to a modern platform. The thesis opened a door. Terra ML walked through it.